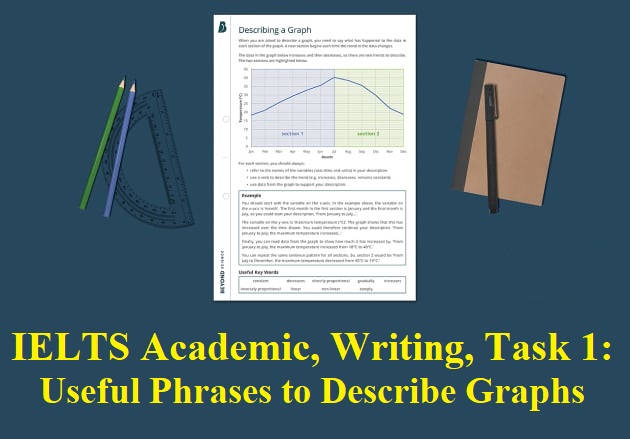
کلمات و عبارات کاربردی در توصیف گراف در تسک اول رایتینگ آیلتس آکادمیک

در تسک اول رایتینگ آیلتس آکادمیک، یک نقشه، نمودار، جدول و مواردی از این دست در اختیارتان قرار می گیرد که شما باید آن را توصیف کنید. با وجود اینکه تنها 150 کلمه نیاز است بنویسید، اما بسیاری از داوطلبان این آزمون برای توصیف گراف با مشکل مواجه می شوند و نمی توانند از ساختارهای و لغات مناسب استفاده کنند. از این رو، در این مطلب، کلمات و عبارات کاربردی در توصیف گراف برای تسک اول رایتینگ آیلتس آکادمیک را بطور دسته بندی شده در اختیارتان قرار می دهیم.
کلمات و عبارات کاربردی در توصیف گراف، تسک اول رایتینگ آیلتس
لازم است بدانید که حفظ کردن این عبارات به شما کمک چندانی نمی کند. سعی کنید پیش از آزمون از این عبارات در حین تمرین توصیف گراف استفاده کنید تا آنها را یاد بگیرید و از کاربرد صحیح آنها در آزمون مطمئن باشید.
Introducing the Visual Data
– The graph/table/chart/map illustrates/shows/presents the data on…
– The visual data depicts/provides information about…
– A comparison of/ between… can be seen in the graph/table/chart/map.
– The data is divided into categories such as…
Trends and Changes:
– There is a significant/noticeable increase/decrease in…
– A gradual/steady rise/fall can be observed in…
– There is a fluctuation/fluctuating pattern in…
– The data experienced a sharp/rapid growth/decline over the period shown.
Comparing and Contrasting:
– In comparison with X, Y experienced a higher/lower…
– X is considerably more/less than Y.
– X and Y show a similar/different trend in…
– The data for X is significantly different from that of Y.
Describing Degree and Frequency:
– A large proportion/percentage of…
– A small minority/percentage of…
– The majority of…
– A significant number of…
– A few examples/incidents of…
– Rarely/seldom/occasionally…
Summarizing and Concluding:
– In conclusion, it can be seen that…
– To sum up, the data suggests that…
– Overall, the trend/pattern shows…
– Based on the data provided, one can conclude that…
General Language for Describing Visual Data:
– The data is represented in the form of a graph/table/chart/map.
– The X-axis represents…, while the Y-axis represents…
– The data is categorized into groups such as…
– It is evident from the visual that…
سعی کنید از ساختارهای و عبارات متنوع استفاده کنید و از طبیعی بودن آنها و کاربرد صحیح شان اطمینان حاصل کنید.
مطالب زیر نیز مفیدند:


