نمونه سوال تسک 1 رایتینگ آیلتس (جدول) همراه با پاسخ

نمونه سوال تسک 1 رایتینگ آیلتس (جدول) همراه با پاسخ
در این بخش نمونه سوال تسک 1 رایتینگ آیلتس را به همراه پاسخ آن برای شما فراهم ساختهایم:
Task 1
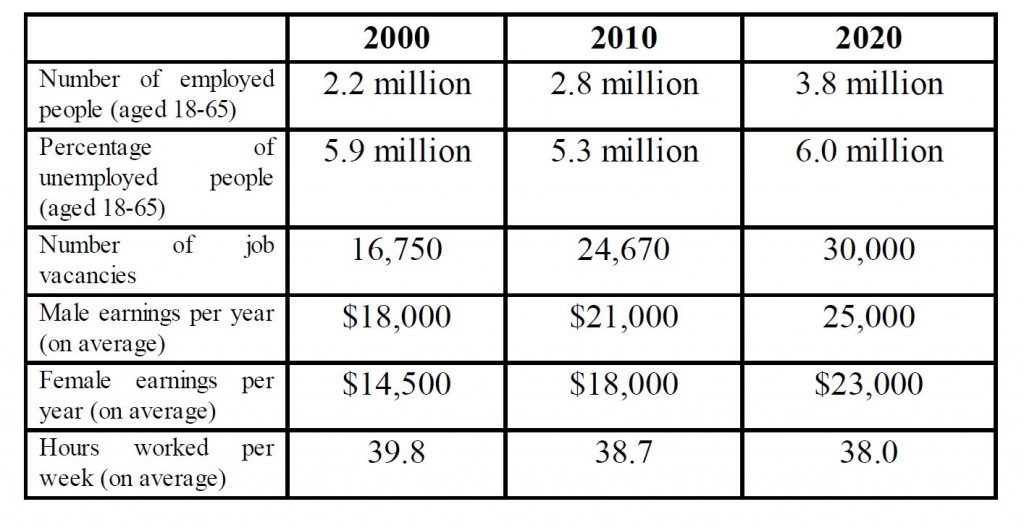
The table below illustrates the employment statistics in Australia in 2000 and 2010, and a forecast of employment figures for 2020.
Summarize the information by reporting and selecting the main features of the graph and making appropriate comparisons where
relevant.
You should write at least 150 words.
Employment Statistics in Australia:
Model Answer:
The table shows the employment statistics in Australia for two different years, 2000 and 2010, and also shows a prediction of statistics for 2020.
The number of employed people increased from 2.2 million people to 2.8 million people and is expected to increase a further million people by 2020. In contrast, the percentage of unemployed people between the ages of 18 and 65 decreased from 5.9 in 2000 to 5.3% in 2010, but is forecast to increase again to 6% by 2020. The number of job vacancies increased substantially/dramatically/noticeably/slightly between 2000 and 2010, from 16,750 to 24,670, respectively; the number of job
vacancies is predicted to continue to rise and reach 30,000 by 2020.
According to the table, male earnings were higher than female earnings in both 2000 and 2010, and are predicted to remain higher into 2020. Male earnings were, on average, $3,500 higher than female earnings/women’s earnings in 2000 and $2,500 higher in 2010. The trend is expected to continue, and by 2020, it is predicted that male earnings will be approximately $2,000 per year higher than female earnings, the lowest discrepancy of all three years shown.
Lastly, the number of hours worked per week decreased between 2000 (39.8 hours) and 2010 (38.7) and is predicted to decrease to 38 hours per week by 2020. This is the only category shown on the table which decreases throughout the thirty year period.
مطالب مرتبط:
نمونه سوال تسک ۱ رایتینگ آیلتس – استفاده از اینترنت در بریتانیا


